Draft
Two pages: Analytics (the store overview) and Post-purchase upsell (a report of its own for the after-purchase funnel). Both read from real orders rather than from an advertising pixel — so the numbers here are yours, and do not depend on whether customers block tracking.
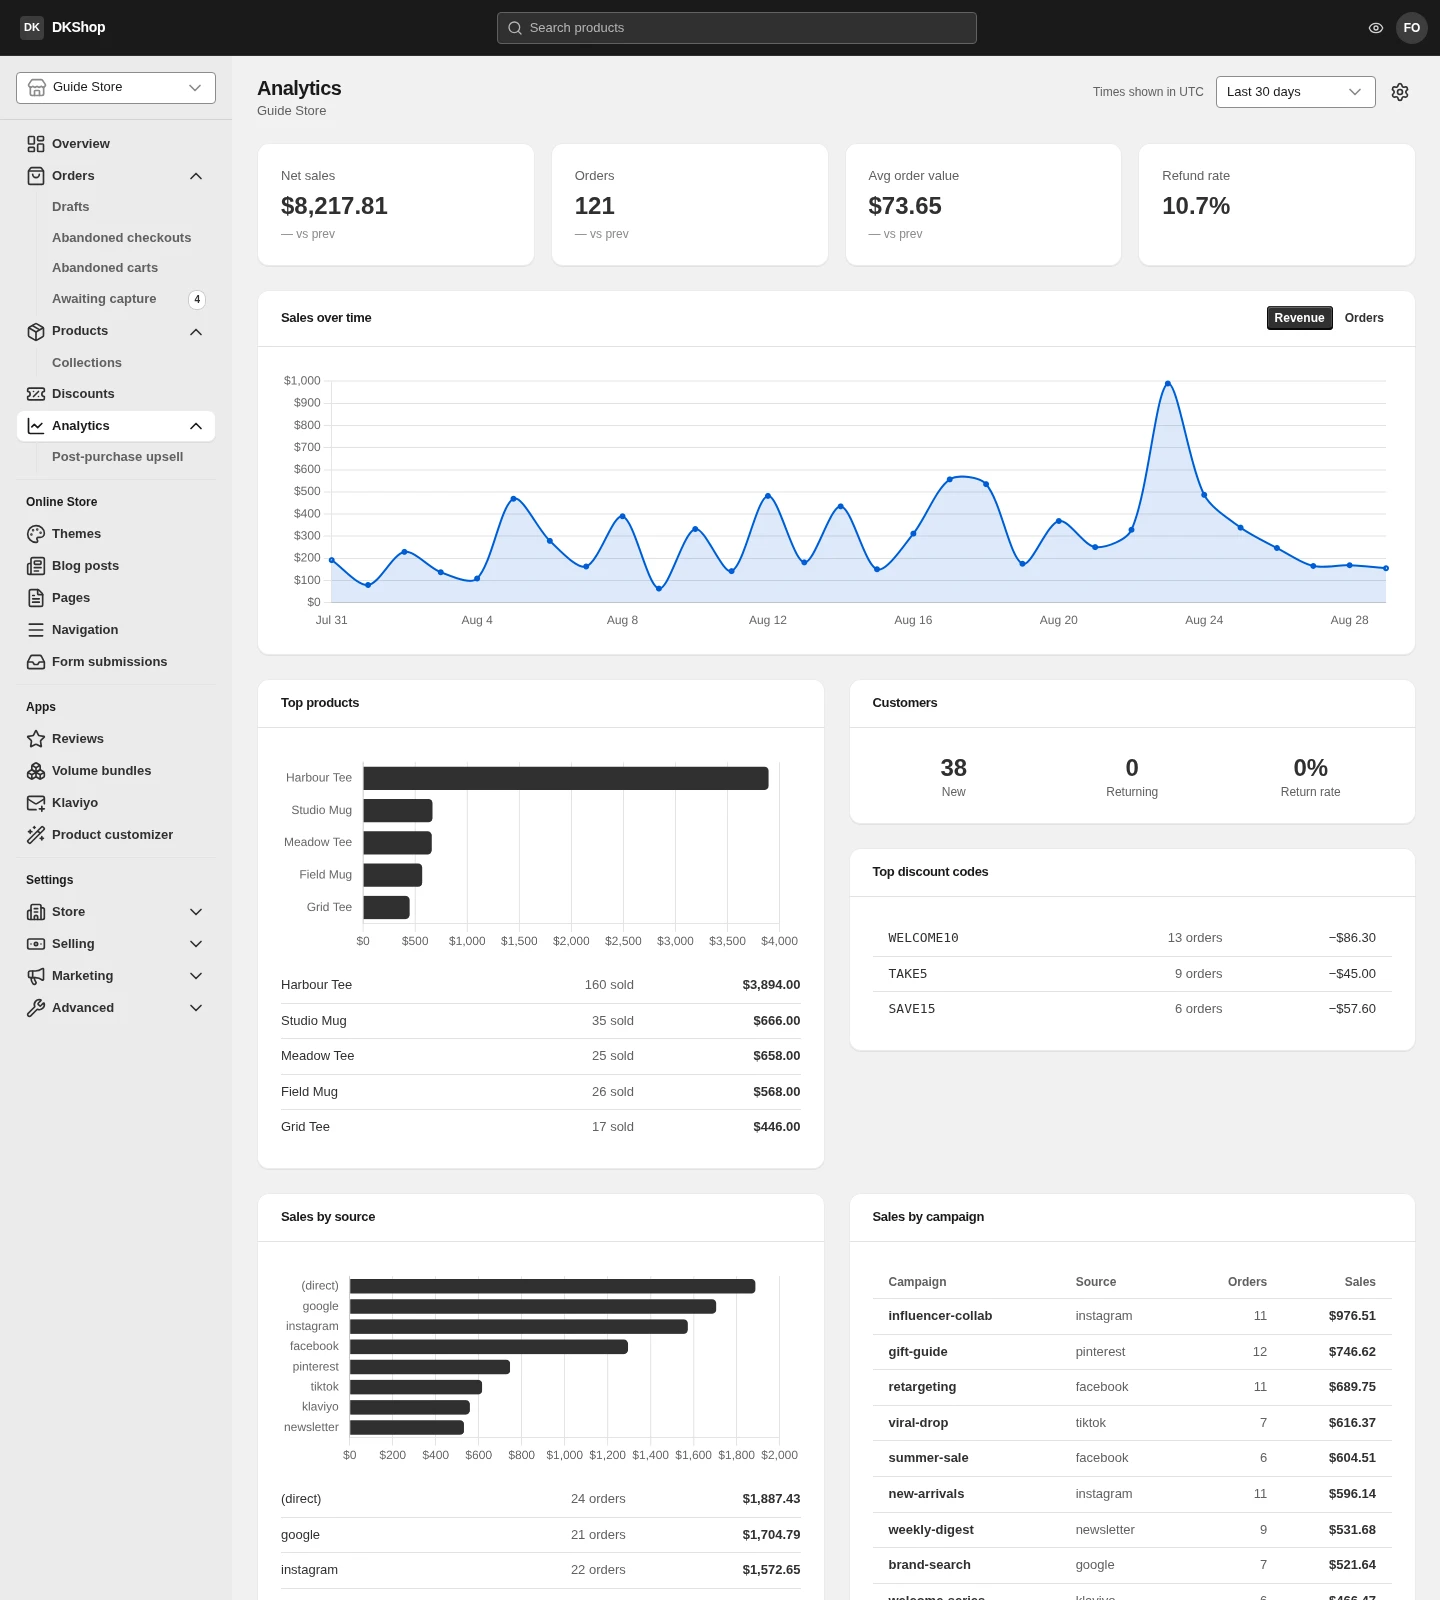
Every date boundary uses the store's time zone, set under Settings → General. The top right says which one is in use. Set it wrongly and "today" in the reports does not line up with your working day, and every day-on-day comparison is offset with it.
The four headline metrics
| Tile | Meaning |
|---|---|
| Net sales | Revenue after refunds, over the chosen range |
| Orders | Paid orders |
| Avg order value | Net sales ÷ Orders |
| Refund rate | Refunded money as a share of the total |
Each tile has a vs prev line comparing it with the immediately preceding range
of the same length — these 30 days against the 30 before. A — means there is not
enough data in the previous range to compare.
The four breakdowns
Sales over time — switch between Revenue and Orders with the two buttons in the corner. The same range, two different questions: revenue can rise because you sold more, or because each order was bigger. Only both together tell you which.
Top products — by revenue, not by units. The sold column in the table below is the unit count, and the two often rank differently: a cheap bestseller can top the unit list and come last by money.
Customers — New against Returning, and the return rate. In a new store Returning is close to zero and that is normal; this number only means something after a few months.
Top discount codes — how many times each was used and what it cost. This is the fastest way to spot a code that has escaped its intended audience.
Sales by source and Sales by campaign — attributed last-touch: whichever
source the customer arrived from last before buying gets credit for the whole order.
That is a convention, not the truth: a customer who sees a Facebook ad, then types
your store name into their browser the next day and buys, is credited to (direct).
(direct)does not mean "came for free". It includes people typing the address, people arriving from a chat app, and every case where the browser sends no source. A store advertising heavily usually sees a large(direct)— much of which was advertising.
The post-purchase funnel report
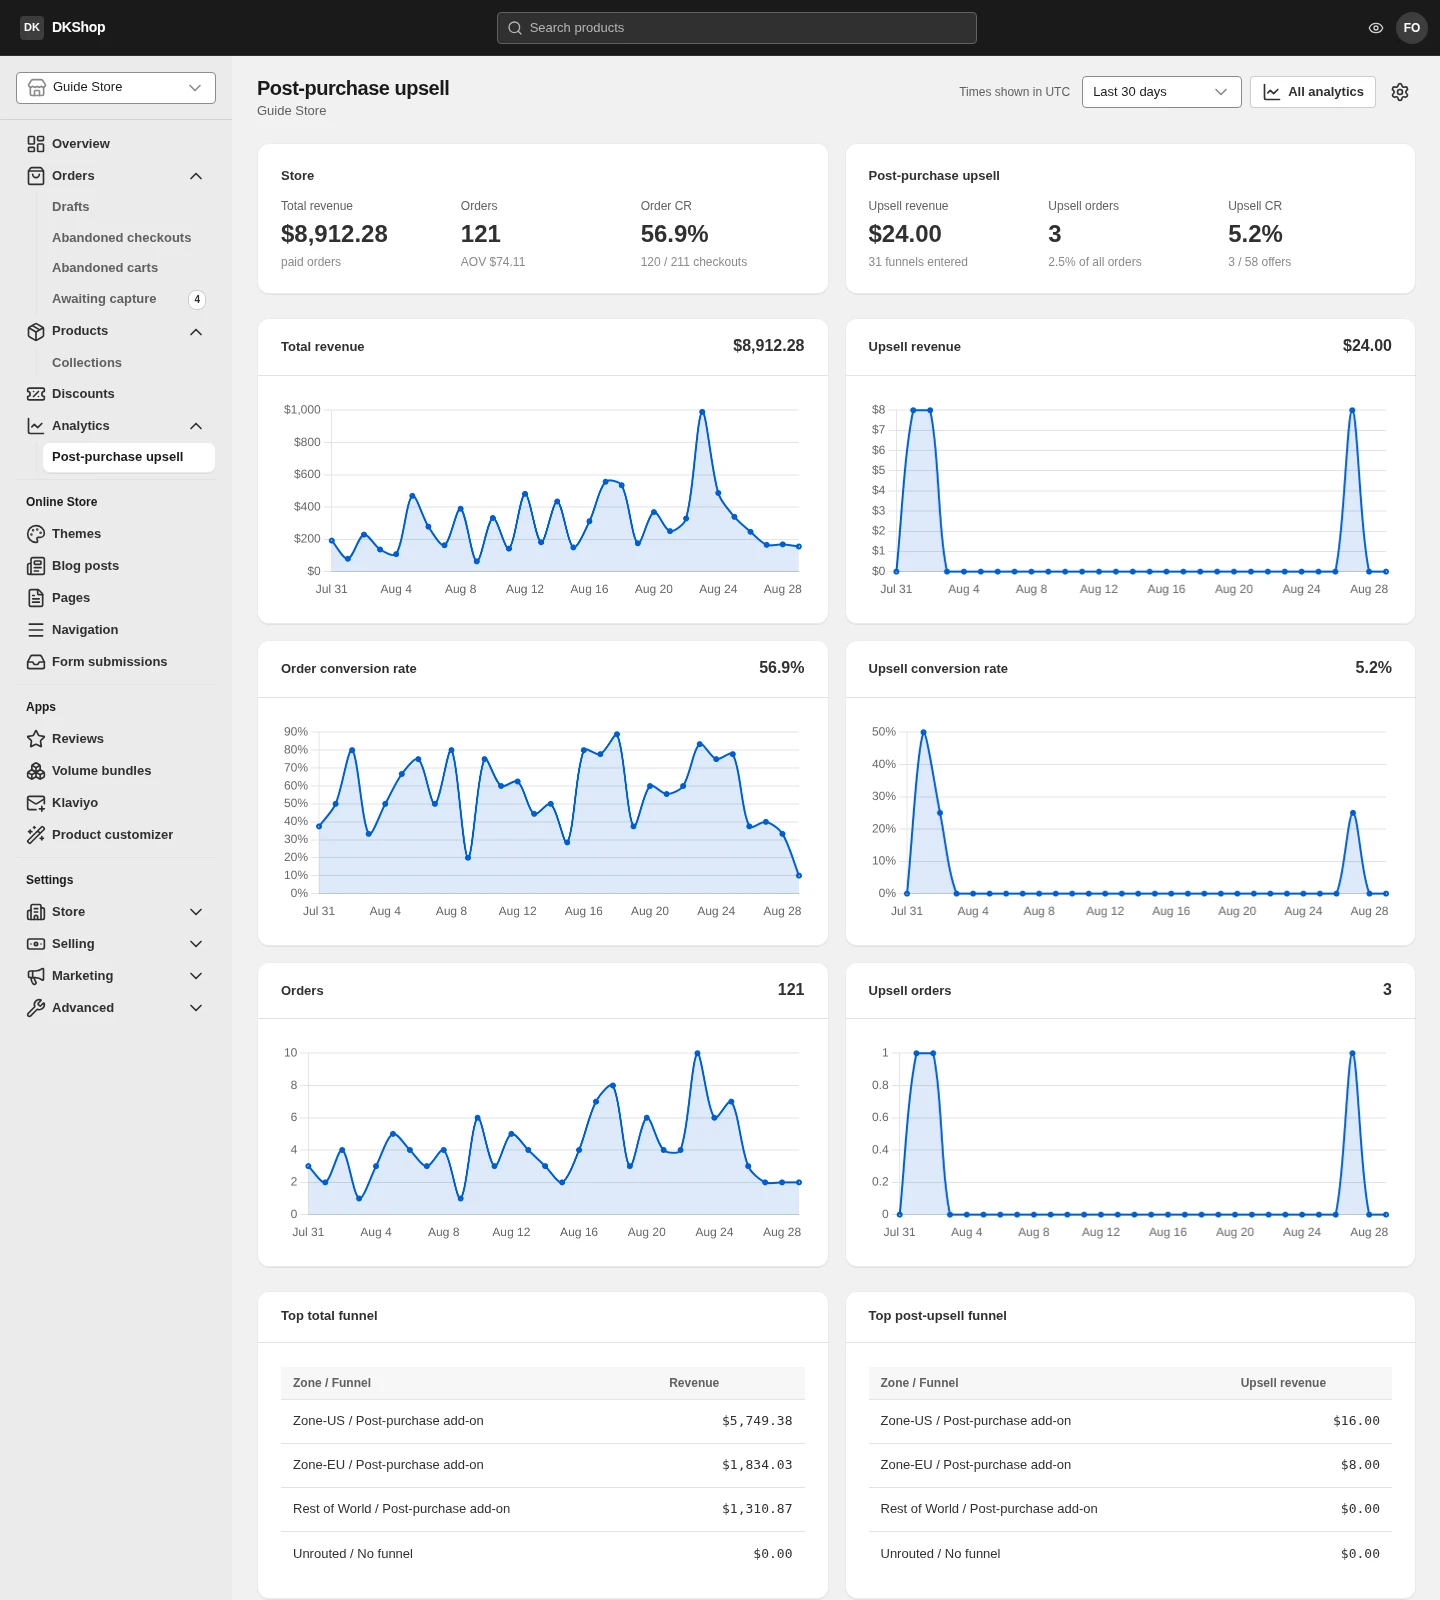
A page of its own for the post-purchase funnel. Six metrics in two groups, and the grouping has a reason: the top group is the whole store, the bottom is only what the funnel contributed.
The Store group
| Tile | Meaning |
|---|---|
| Total revenue | All revenue from paid orders |
| Orders | The order count, with AOV |
| Order CR | Conversion: how many checkouts became orders |
The Post-purchase upsell group
| Tile | Meaning |
|---|---|
| Upsell revenue | The extra revenue the funnel produced, with how many entered it |
| Upsell orders | Orders with at least one offer accepted |
| Upsell CR | The accept rate: offers accepted / offers shown |
Read the denominator of Upsell CR carefully. It is offers shown, not orders. A three-step funnel shows up to three offers to one customer, so the denominator is much larger than the number of people — and 15% here is not comparable to "15% of orders had an upsell". For that second number, read the Upsell orders tile, whose hint line already gives the share of all orders.
Four charts and two breakdowns
Four charts over time: total revenue · upsell revenue · order conversion · upsell accept rate. Each states the total for the whole range in its header, so you do not have to scroll back to the metrics to know the scale.
Below are breakdowns by checkout zone and by funnel step. The step table is the one worth reading when tuning: it says how many times each step was shown and how many times it was accepted, so you can see immediately which step is being declined and needs a different offer.
Why these numbers differ from Facebook's
This question always comes, so here it is up front:
- These are orders; those are events. This page counts paid orders in the database. An ad platform counts events the browser sent, and some are blocked.
- Different attribution. Here it is last-touch. Facebook by default credits an ad clicked within the previous 7 days, even if the customer came back another way.
- Refunds. Net sales here has refunds deducted; advertising reports usually do not.
Neither number is "more correct". Use this page to answer "how much did the store sell", use the ad reports to answer "is the advertising working", and do not expect the two to match.
Reference
| Where | Control | Notes |
|---|---|---|
| Analytics | The range picker | Top right |
| Analytics | Times shown in … | The store time zone, set under Settings → General |
| Analytics | Revenue / Orders | Switches the Sales over time metric |
| Analytics | Top products | Ranked by revenue; the sold column is units |
| Analytics | Customers | New / Returning / return rate |
| Analytics | Top discount codes | Uses, and money discounted |
| Analytics | Sales by source / campaign | Last-touch attribution |
| Upsell | The Store group | The whole store |
| Upsell | The Post-purchase upsell group | Only what the funnel contributed |
| Upsell | Upsell CR | The denominator is offers shown, not orders |
| Upsell | The step table | Per step: how many shown, how many accepted |
| Upsell | All analytics | Back to the overview |
Next: Klaviyo — connecting the store to an email marketing platform.
Verified against 82dff35b1474 · 2026-08-29